It is a commonly held opinion that tennis is one of the sports in which the psychological component weighs the most during matches. Proof of that is, for example, that Timothy Gallwey, one of the fathers of Business and Life Coaching, was inspired by his experience as a tennis coach in writing his best seller “The inner game of tennis”, published in 1974 and in some ways still very relevant today. In more recent times, even Agassi and Panatta have insisted a lot on this aspect in their autobiographies, with the italian using this concept in the title of his book, stating boldly that “tennis was invented by the devil”.
This close connection between what happens on the court and what happens in the mind of the players often leads to proverbial statements that, it can be said, are viewed as conventional wisdom. For example, it is believed that, precisely for psychological reasons, the seventh game, in a set tied at 3-3, is particularly important because it breaks the balance just when the set enters its bottom half. Or, again, it is commonly believed that, particularly in a match that goes to the fifth set, the first player serving has an advantage in the decisive set, thus causing in the opponent the unpleasant feeling of chasing at a time when the match is about to end.
The growing availability of structured data related to ATP matches allows us to put these claims to the test, and to verify their veracity. For this purpose, we will consider all of the men’s singles matches in Grand Slam tournaments of the last decade, from 2011 to 2021. Considering this huge database, let’s start by asking ourselves the first question: does the one player who wins the seventh game on a 3-3 tied set win the set in the end?
THE 7TH GAME
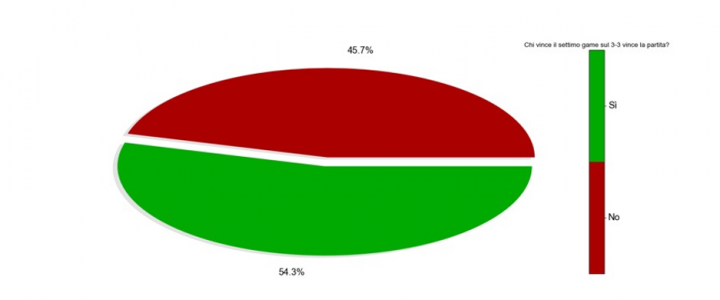
At a first glance, it would be tempting to answer in the affirmative. In fact, in 54.3% of cases whoever goes 4-3 by winning the seventh game ends up winning the set. But to attest to the validity of this first superficial observation it might seems appropriate to ask ourselves, more specifically, whether gaining the advantage at that particular moment is more significant or helpful than doing it slightly earlier, or slightly later. In other words: does winning the seventh game at 3-3 carry more weight than winning the ninth game at 4-4, or the fifth game at 2-2?
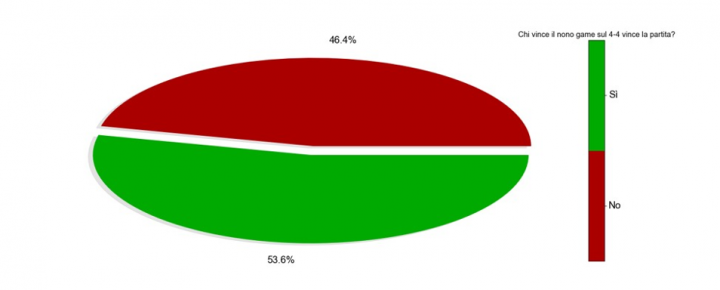
Figure 2. Percentage of cases in which whoever wins the ninth game at 4-4 wins the set, 2011-2021 Grand Slam tournaments
The set is won by whoever wins the ninth game after a 4-all in 53.6% of cases. Comparable, but slightly lower than the 54.3% recorded for the seventh-game-case in a tied set. Considering that the ninth game is closer to the ending of the set, winning a game in that situation should have a bigger impact. Therefore it would be tempting to identify a correlation, albeit not particularly strong, between the vin in the seventh game at 3-3 and winning the set. Before getting to any conclusion, however, let’s repeat the analysis, this time examining the fifth game at 2-2.
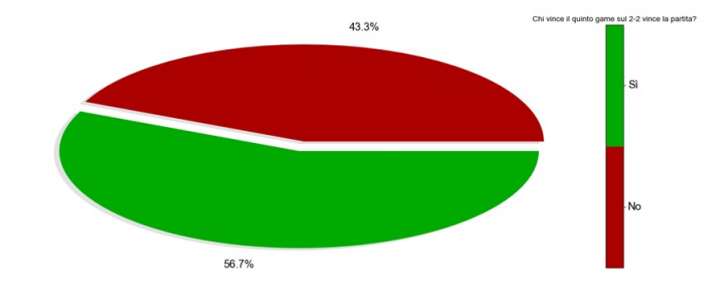
Perhaps a little surprisingly, we find that, at 2-2, the set is won in 56.7% of cases by whoever wins the fifth game. Although this game takes place further away from the end of the set, it seems to have a greater effect on the final outcome of the set. Although this fact alone is not proof in debunking the myth of the seventh game, this simple analysis has perhaps the merit of generating some doubts and some more curiosity, bringing to the forefront a hypothesis that comes from experience in more direct touch with the data. Let’s try to apply this logic to another statement as well: it’s better to serve first in the final set.
SERVING FIRST IN THE DECIDER
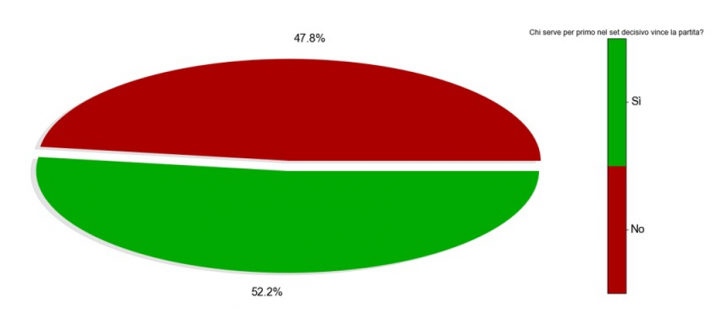
Let’s focus on the 728 Grand Slam matches that have reached the fifth set over the last ten years. Indeed, the percentage of cases in which whoever served first in these 728 occasions won the set (and, consequently, the match) is greater than 50%: to be precise, the count is 380 cases (52.2% of the total). Looking back, we can consider that, if such an advantage really exists, it is reasonable to expect it to be greater in the case of the Australian Open, Roland Garros and Wimbledon, which, for a large part of the period considered, did not provide have final set tie-breaks or super tie-breaks, with (possible) prolongation of the psychological pressure on whoever is serving second.

Australian Open, Roland Garros and Wimbledon 2011-2021
Indeed, 310 of the 576 matches of the Australian Open, Roland Garros and Wimbledon of the last 10 years in the fifth set were won by the player who served first: 53.8% of the total. A higher percentage, therefore, than the one observed also considering the US Open’ s data. We can therefore say that, in this case, at least for this analysis’ sake, there seems to be a correspondence between conventional wisdom and actual data.
Let’s now move on to the critical analysis of a third consideration, common indeed, but not necessarily supported by the data: in a hard-fought match, whoever wins the most games who go to deuce will win the match in the end.
DEUCE GAMES
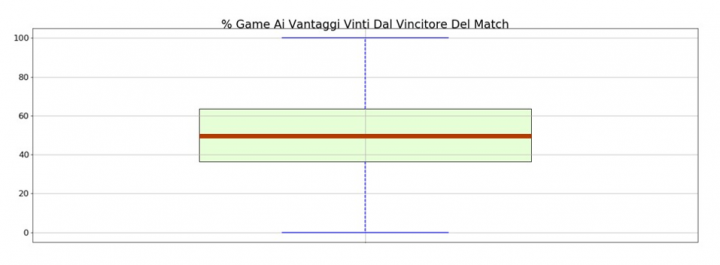
To analyse this statement, and to measure its coherence with the trend of men’s singles matches in Grand Slam tournaments over the last ten years, let’s first focus on the matches with at least ten games that went to 40-40. This will allow us to focus on the statistically more significant data. Winning ten deuce games out of ten (100% of them), for example, has a different weight than winning the only one who went the distance.
Preparing the dataset for analysis, we can see that in the last ten years 2,050 men’s singles matches have been characterized by at least ten hard-fought games. To evaluate whether, starting from this subset of games, the victory of the games with advantage points is significantly linked to match wins, let’s try to use a different graphic representation: the box-plot.
The box plot represents the statistical distribution of a variable, in this case the percentage of deuce games won by the winner of the match for the 2,050 matches considered. A commonly used concept, in the analysis of statistical distributions, is that of the percentile. Let’s imagine we order the hard-fought-game percentages won by the winners of the 2,050 matches considered in ascending order. Match number 205 of this ordered list would be classified as the to the 10th percentile of the distribution (given that 205/2050 = 0.1 = 10%). In the box plot, we see a thin yellow bar to identify the fiftieth percentile, also called the median of the distribution. If the percentage of deuce games won was particularly significant, we would expect a median value, for the winners of the matches, greater than 50% – but this is not the case.
Not just that: the green colored area of the box-plot defines the range within which the “central” 50% of the distribution is found. That is, the lower end of the green colored area coincides with the twenty-fifth percentile of the distribution, the upper end with the seventy-fifth. We observe that the central band of the distribution has the same excursion towards the lower extreme (50% -36.4% = 13.6%) than the upper one (63.6% -50% = 13.6%).
As a further check, let’s ask the data the same question once again, using a different survey tool: the ROC curve.
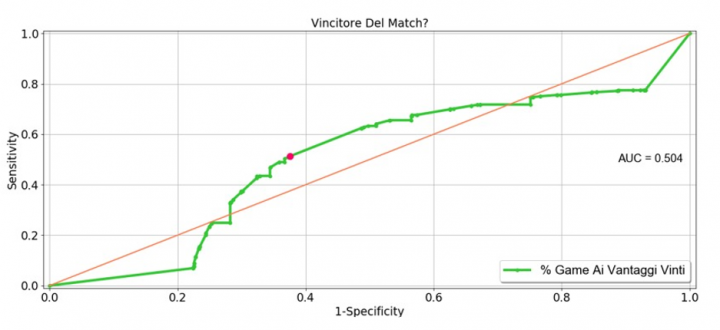
We will ask ourselves, this time, if there are thresholds (not necessarily 50%) of 40-40 games that can become decisive for the match win. Once again, for the reasons already mentioned, we will focus on matches with at least ten hard-fought games. To conduct this type of analysis, we can use the ROC curve.
To trace it, we will proceed as follows:
- every possible threshold value is considered in terms of percentage of deuce games won, starting from 0% up to 100%
- for each of these values (let’s take 10% for example) we ask ourselves: how accurate would it be to say that whoever wins more than 10% of the game at the advantages wins the match?
- the answer to this question is analysed using two components: sensitivity (i.e. the percentage of correctly identified victories) and specificity (i.e. the percentage of correctly identified losses)
- each threshold can therefore be represented as a point, drawn in a chart in which the vertical axis is represented by the wording “Sensitivity” and the horizontal axis represented by “Specificity”
- by connecting these points, a curve can be drawn, called ROC curve (Receiver Operating Curve)
- it can be shown that the area included under this curve, called AUC (Area Under the Curve) equals to the probability that, given a pair of matches (match 1 and match 2), the percentage of deuce games won by the winner of match 1 is greater than the percentage of deuce games won by the loser of match 2.
The more the AUC approaches to the value of 1, the more the element considered (in this case the percentage of deuce games won) is relevant compared to the target (the match win). We observe that, in this case, the AUC is equal to 0.504, just above 50%. The lack of relevance of deuce games supremacy therefore seems to be confirmed.
Let’s now try to ask ourselves if, indeed, as is often supposed, the victory of the first set is often decisive, especially for the underdog player.
THE FIRST SET IS KEY, ESPECIALLY FOR THE WEAKER PLAYER
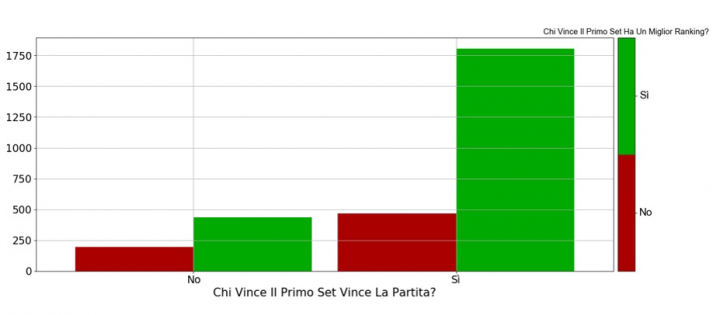
The matches in which the winner of the first set has a better ATP ranking at the end of the season is represented by the green bars of the histogram, the other matches are represented by the red bars. So let’s ask ourselves if, especially in a Grand Slam tournament, considering the men’s singles matches only and therefore a three out of five set match, the victory in the first set is relevant and, more specifically, let’s try to understand if this consideration is more valid for players who face an opponent of greater clout, or with a better ATP ranking.
First of all, we observe that 2,271 of the 2,902 matches considered ended with the victory of the player who won the first set: in other words, in 78.2% of cases whoever won the first set also won the match. This is by far the strongest pattern explored in this article. For example, if we consider the effect of ranking on the outcome of the match, we observe that in 2,238 cases out of 2,902 (i.e. in 77.1% of cases) the match is won by that player who, at the end of the season, will occupy a better position in the ATP ranking. In other words, the victory of the first set seems to “weigh” even more (albeit slightly) than the ranking in the outcome of the match.
And, as conventional wisdom teaches, the combination of the two factors is even more predictive of the name of the match winner. In fact, if the first set is won by the lower ranked player, the opponent will manage to get away with it in 30% of cases (196 matches out of 664). If, on the other hand, the better-ranked player takes the first set, then his opponent seems to have less than a 20% chance of reversing the situation (435 cases out of 2238).
This is what the data tell us, which, as always, we try to approach with a critical eye. That is, always keeping in mind Henri Poincarè, according to whom “science is made of data as a house is made of stones. But a mass of data is no more science than a pile of stones is a real house.”
Article by Damiano Verda; translated by Michele Brusadelli; edited by Tommaso Villa


